
Weekly Market Commentary June 15, 2026
LPL Research explains the IPO process, reviews high profile candidates, and provides context on potential market impacts.

Last Edited by: LPL Research
Last Updated: June 15, 2026
Introducing the IPO Class of 2026
The U.S. initial public offering (IPO) market appears to be entering one of its most consequential periods in years. After a long drought following the 2021 issuance boom, a healthier macro backdrop, improved risk appetite, and a long queue of mature private companies have reopened the new-issue window. The potential 2026 class is unusual not only because of the number of companies considering public listings, but because several would be large enough to matter for major equity indexes, passive fund flows, and the broader market narrative around artificial intelligence (AI).
An important piece of framing we'd like to re-iterate upfront is that we are not making any judgment (or recommendations) about specific IPOs, or even IPOs broadly. That said, we remind readers of what the IPO process is designed to do: raise capital and create liquidity for the issuer and existing shareholders. Historically, new issues have produced a wide range of outcomes. Some of the market's great companies became public companies through IPOs, but the first year after listing has often been volatile, and median performance has historically tended to trail the simple average because a relatively small number of large winners can skew the data.
Here, we explain the mechanics of the IPO process, review several high-profile candidates that may be planning to come to market, discuss why the 2026 issuance wave could matter for market structure, place the current environment in historical context, and provide an analytical framework for thinking about new issues. We are not making a recommendation on any individual company. Instead, we aim to provide a general framework for understanding IPO dynamics and considerations as companies transition from private to public markets.
IPOs 101: What Investors Are Actually Buying
An initial public offering, or IPO, is the process by which a private company sells shares to public investors and lists those shares on an exchange. The mechanics can sound straightforward: the company files a registration statement, hires investment banks to underwrite the offering, markets the story to investors during a roadshow, prices the deal, and begins trading. In practice, the process is a negotiation among management, existing shareholders, underwriters, institutional investors, index providers, and eventually retail buyers in the secondary market.
The distinction between the offering price and the first public trading price is especially important. The IPO price is the price at which shares are allocated by the underwriting banks, usually largely to institutional investors. Many ordinary investors do not receive meaningful access to that price. They buy after the stock starts trading, sometimes after a first day "pop." A company can be an excellent business and still be a disappointing IPO investment if the first public price already discounts years of optimistic growth.
Investors should also understand lockups. In many IPOs, insiders and early private investors agree not to sell for a period, often around 180 days. When that lockup expires, additional supply can enter the market. That supply does not guarantee a decline, but it can create an overhang, especially when early investors have large unrealized gains and public-market investors are still debating valuations.
The Potential 2026 Class: Familiar Names, Unfamiliar Scale
Several companies, across sectors including technology and AI infrastructure, are in advanced stages of going public. These companies would arrive on public markets with brand recognition and private-market valuations that are far larger than the typical IPO. SpaceX is the most visible example, particularly after its public S-1 filing. LPL Research recently published a blog digging into SpaceX's S-1 filing, "Counting Down to the SpaceX Launch". Its business combines launch services, Starlink satellite broadband, defense and government work, and ambitious longer-term opportunities in space infrastructure and AI.
So-called "AI labs", or "frontier AI model companies", are another focal point. Certain AI-focused companies such as OpenAI have gained significant visibility due to rapid consumer adoption of large language model technologies. In terms of fund-raising and a potential public offering, on March 31, 2026, OpenAI announced a record $122 billion funding round at a post-money valuation of $852 billion, and on June 8 announced that it has confidentially submitted a draft S-1 filing with the SEC, which is among the first steps a private company must take prior to issuing and offering shares to the public.
Anthropic PBC is a San Francisco-based AI safety and research company with a focus on the enterprise AI market. Its Claude models are distributed directly and through partners such as Amazon Web Services, Google Cloud, Snowflake, Databricks, and Microsoft-related developer channels. On May 28, Anthropic announced a $65 billion fund raise, at a post-money valuation of $965 billion, and on June 1 announced that it has confidentially submitted a draft S-1 filing, paving the way for its own IPO.
The contrast between the two companies is useful for investors. OpenAI's core advantage is distribution, with ChatGPT spanning consumer, developer, and enterprise use cases. Alternatively, Anthropic focuses primarily on business/enterprise customers, particularly coding and knowledge work productivity and automation, via Claude Code and Claude Cowork product lines, respectively.
At private market valuations of hundreds of billions of dollars, the market is underwriting not only a promising software product, but a long-duration bet on AI becoming a core layer of the economy, on model providers retaining pricing power despite intense competition, and on infrastructure spending ultimately translating into attractive margins. For both OpenAI and Anthropic, the public-market debate is likely to center on whether rapid revenue growth, consumer and enterprise adoption, and agentic workflows can offset high inference costs, training expenses, talent competition, litigation risk, and potential model commoditization.
Other recent and pending IPOs help frame the environment in which mega-deals may arrive. Cerebras, CoreWeave, Figma, Medline, and other recent listings have shown that investors are willing to fund differentiated growth stories, but performance has been uneven. Strong first-day demand has not necessarily translated into sustained outperformance. That is a useful reminder for investors preparing for larger and louder offerings.
Why This Matters for Markets
A normal IPO can matter a great deal for the issuing company and its shareholders, but it is usually too small to affect the S&P 500 or Nasdaq-100. The 2026 setup is likely to be different. A recent estimate from Goldman Sachs called for roughly $160 billion of U.S. IPO gross proceeds in 2026, which would be among the largest annual totals on record if realized, particularly when excluding the Special Purpose Acquisition Company (SPAC)-heavy distortions of 2021. The reasons 2026 could play out differently than prior large IPO years are the combination of large deals, low public floats, heavy passive ownership across markets, and faster potential index inclusion.
New issuance must be absorbed. Investors who buy a new IPO may fund that purchase by deploying cash, but they may also sell existing holdings. If several very large transactions arrive close together, that "making room" process may add to volatility. The risk is most relevant when market liquidity is thin, positioning is crowded, or the new issues overlap with themes investors already own heavily, such as mega cap technology and AI infrastructure.
Index rules are an increasingly important part of the discussion. Nasdaq recently implemented changes to the Nasdaq-100 Index designed to allow faster inclusion of large newly public companies, as well as changes in weighting methodologies related to float-adjusted market capitalization. Previously, newly listed companies often had to wait until an annual index reconstitution before joining the index. The updated rules now allow Nasdaq-listed companies to be evaluated for "fast entry" if their market capitalization ranks within the top 40 of the current constituents' market cap, providing a path to joining the index in as little as 15 days. In terms of eligible market cap and float requirements, the new rules will include unlisted shares that are not publicly traded (such as those held by founders/insiders) in market cap calculations, and the 10% minimum float requirement has been removed. Regarding the "low-float" rule changes: while minimum float requirements have been removed, the index will now leverage a "modified market cap" calculation that caps the total shares outstanding at three times the free-floating shares.
On May 27, Russell FTSE indexes announced similar changes to “fast track” large IPOs as well. The Dow Jones S&P Index committee had been the “elephant in the room” in terms of deciding whether to change their own index inclusion rules, but on June 4 announced that it will not be making any changes as it relates to the treatment of socalled “MegaCap Companies” expected to IPO. This decision was seen as a surprise by many as it deviated from peers, and while there are surely some who disagree, we read the consensus feedback as positive. For what it’s worth, we agree with their decision and also viewed it positively.
Faster index inclusion matters because passive funds tracking an index will need to buy a stock soon after it joins the benchmark. Active managers may also face pressure to own it because omitting a large benchmark constituent can create active risk. In plain English, investors who own broad-market index funds could become shareholders of newly public companies much sooner than they would have in prior cycles.
These factors combined all suggest that the current environment has unique features not present in recent large IPO calendar years: higher index concentration, larger passive assets, faster index inclusion, the possibility of very low float for massive companies, and an AI trade already central to market leadership.
What History Says About IPO Performance
Our prior analysis ("How To Think About IPOs in 2026") of roughly 1,500 IPOs over the last 30 years found that IPO performance has been a mixed bag, and returns have been quite volatile. Measuring from the close of the first trading day, the average one-year return was positive, but the median return was negative. The results of our analysis were, for the most part, in-line with what any Statistics 101 student should expect in a distribution of asymmetric data with a long right tail of outcomes that has theoretically unlimited upside but capped downside, as the most negative potential data point would be -100% (the most an unleveraged investor can lose is 100% of their capital). Such a right-skewed distribution will show a larger mean (average), which for our sample of returns was 10.4%, than median, which was -4.7%. A few outsized performers can pull up the average even when the median IPO performance is less impressive. The distribution of performance is detailed in "Distribution of One-Year Returns (From Closing Price of First Day of Public Trading)".
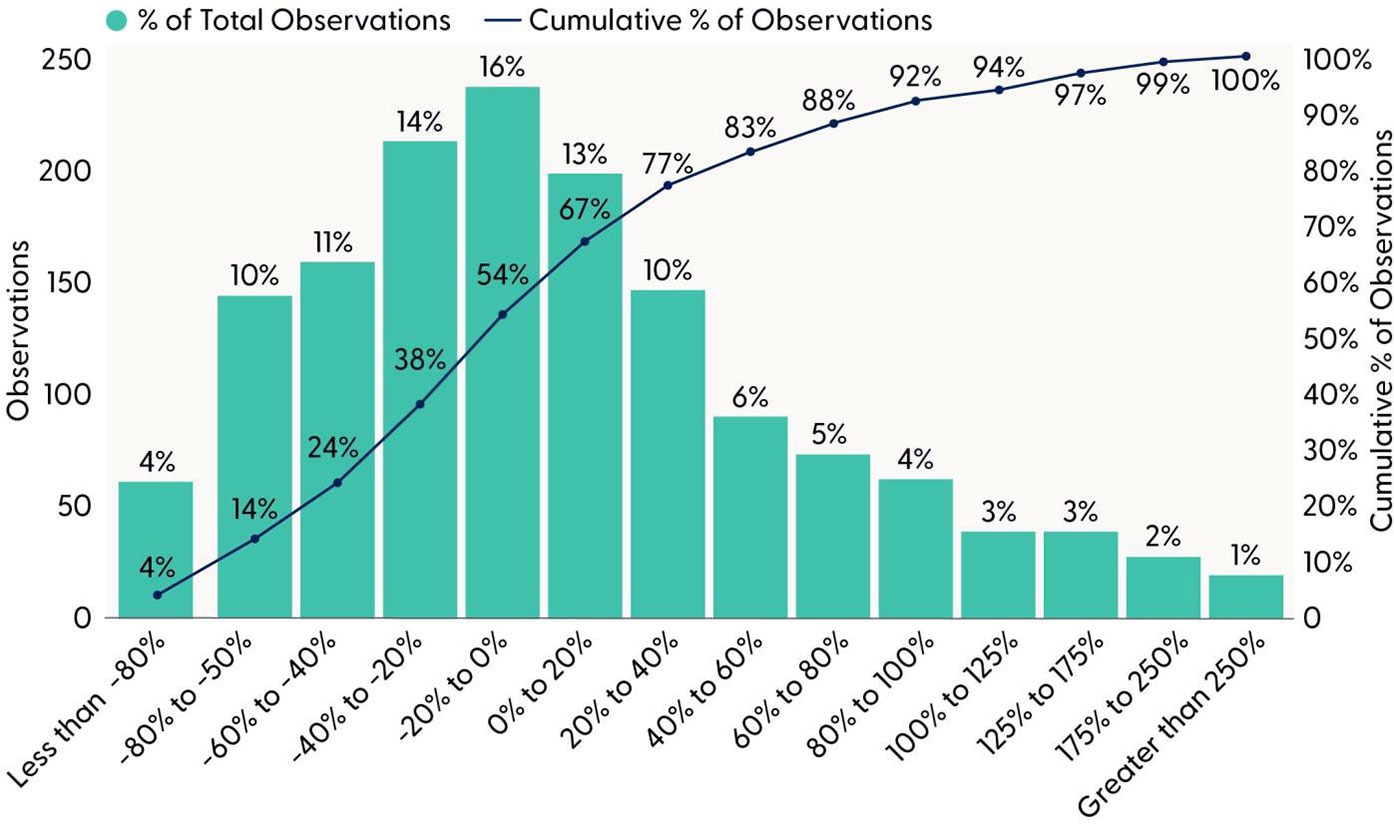
Source: LPL Research, Bloomberg, 06/03/26
Disclosures: Past performance is no guarantee of future results. Data includes IPOs that offered at least $50 million, April 1995 – April 2025
Furthermore, the path of price performance has often been uncomfortable regardless of the endpoint. The average maximum drawdown in the first year after an IPO was 48.9%, and the median drawdown was similar at 48.0%. That means even most positive outcomes typically experienced steep declines in their first year of trading in public markets. Relative performance was also challenging — only 40.6% of the sample outperformed the S&P 500 during the first year after listing. Additional highlights from our analysis are presented in "Summary Statistics From IPO Research", and performance and drawdown metrics from a subset of new issues from our dataset are presented in "Performance and Drawdown Statistics From IPO Research: Sampling of Observations".
Summary Statistics From IPO Research
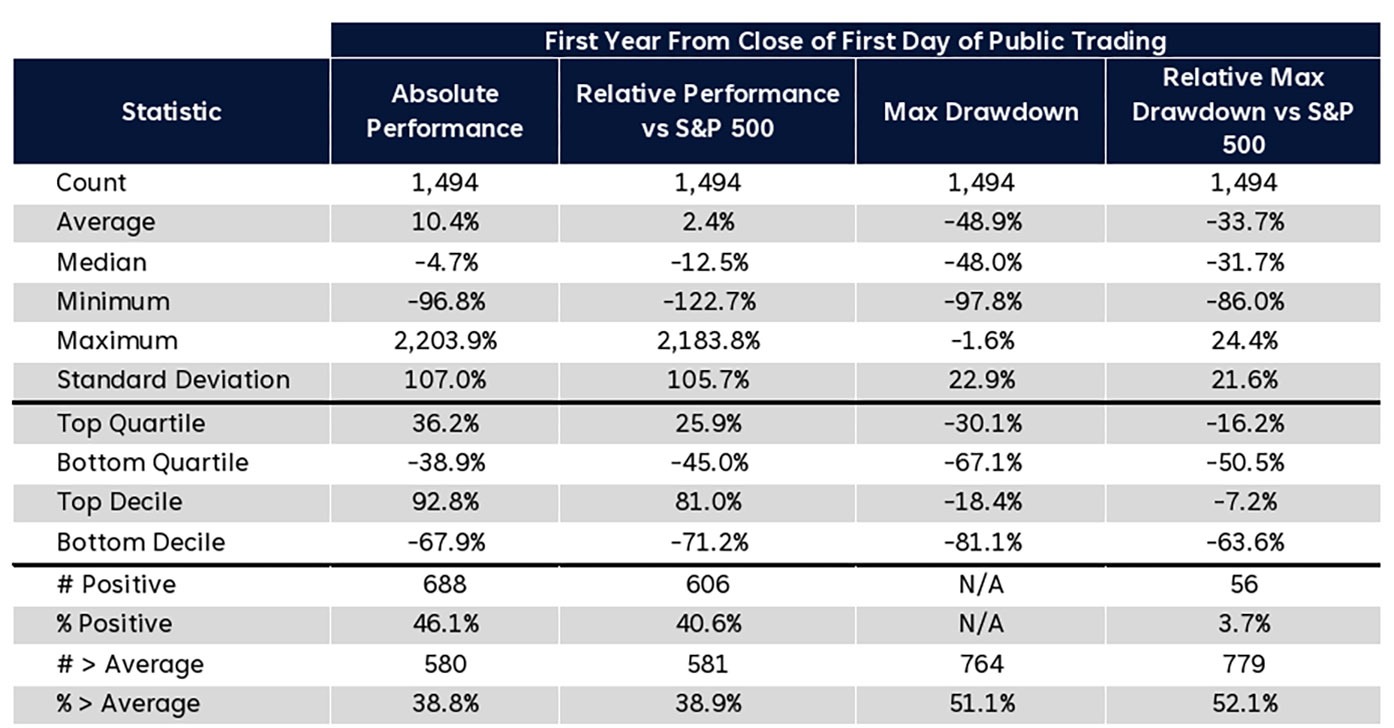
Source: LPL Research, Bloomberg, 06/03/26
Disclosures: Past performance is no guarantee of future results. Data includes IPOs that offered at least $50 million, April 1995 – April 2025
Performance and Drawdown Statistics From IPO Research: Sampling of Observations
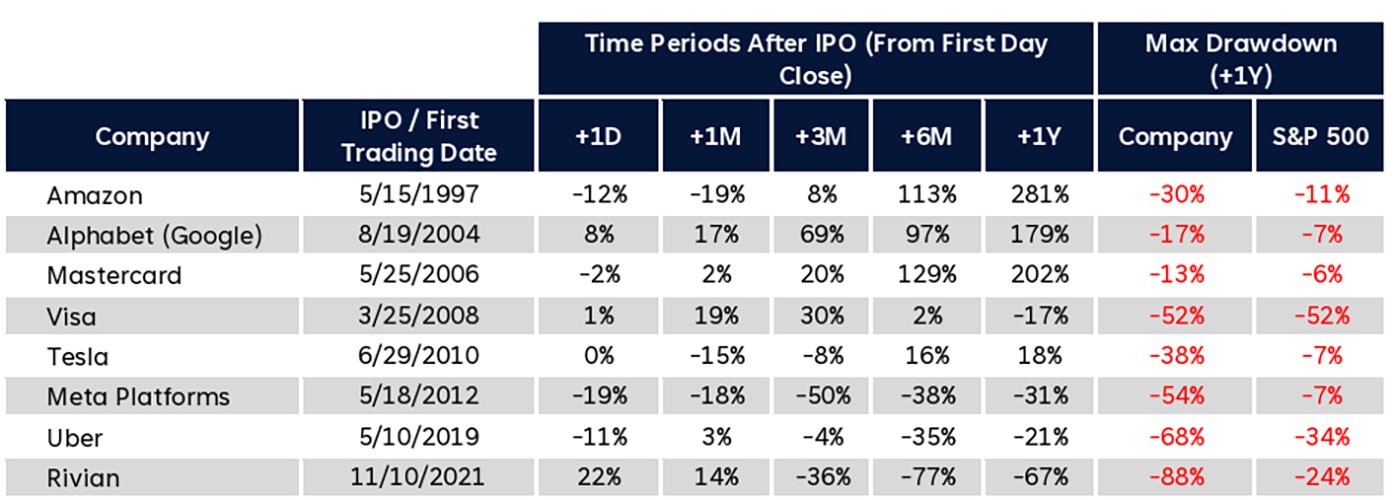
Source: LPL Research, Bloomberg, 06/03/26
Disclosures: Past performance is no guarantee of future results. Data includes IPOs that offered at least $50 million, April 1995 – April 2025
AI IPOs and the Narrative of the AI Trade
The AI trade has been supported by a relatively simple bull-market narrative: the companies spending the most on AI infrastructure (large cloud platforms and hyperscalers) are profitable, cash-generative businesses, while many of the most visible beneficiaries are established semiconductor, networking, power, and data-center companies. That has led many in the market to suggest that this cycle is different from the late-1990s dot-com internet bubble, when many public companies had limited revenue, no profits, and business models that were still largely theoretical. However, a wave of AI model company IPOs could complicate that narrative, as the market will soon be asked to underwrite a different part of the AI ecosystem.
Said differently, we may be entering a new part of the cycle, where public market participants will receive quarterly financials for not only the beneficiaries of the AI capital expenditure boom (infrastructure providers, a.k.a. the "picks and shovels") but also for the application and model layers where adoption and user growth is high but long-term profitability remains an open question. The fundamentals of most large public AI infrastructure providers have perhaps raised some concerns around capital spending, but much of the spending up to this point has been supported by operating cash flow from existing business lines. If the market begins to question the economics, the narrative could shift from "AI capex is funded by profits" to "AI growth requires continuous capital." Further, the valuation math for the AI model companies embeds expectations not only of continued near-term adoption trends, but also confidence that they will become durable, profitable businesses in the AI economy.
Separating the Business From the Stock
As formerly private companies debut on public markets, analysts should look to answer three questions that are often blended together. First, is the company strategically important? Second, is the business model likely to produce attractive long-term economics? Third, is the valuation attractive enough to compensate investors for the risks? The answer to the first question can be yes, while the answer to the third is no. Note, that any analysis done around valuation must also must be cognizant of the fact that ordinary investors won't have access to whatever IPO price that may be reported in the press; once a new issue begins trading, the price is dictated by the market, not bankers or institutional investors or founders. So, valuation analysis must be nimble, and analysts should not lose discipline in the face of FOMO (fear of missing out). See our historical analysis again as a reminder of potential volatility. Patience is a virtue.
Any practical company evaluation framework should start with revenue quality. Recurring revenue, a diversified customer base, strong retention, and pricing power generally deserve more credit than one-time project revenue or revenue concentrated in a few customers. Next up, the path to profitability and free cash flow should be evaluated. Many high-growth companies can justify near-term losses if those losses are funding durable customer acquisition or infrastructure that later scales. But losses caused by structurally high variable costs, intense price competition, or perpetual capital intensity are harder to make up in the future.
Valuation discipline is equally important. Price-to-sales multiples can be useful for fast-growing companies, but they are not a substitute for unit economics. A company trading at a high sales multiple must eventually convert revenue into earnings and cash flow. If the stock prices in near-perfect execution, even strong operating performance may not be enough. Conversely, some IPOs become attractive after the initial excitement fades, lockups expire, or the market gains more confidence in reported results. Again, we remind readers that patience is a virtue.
Finally, analyze the structure of the public offering. Float, voting control, lockup schedules, use of proceeds, relatedparty transactions, and index eligibility can all influence near-term trading. A low float can support a stock early by limiting supply, but it can also increase volatility and set up future selling pressure when additional shares become eligible for sale. Governance also matters. Super-voting shares, founder control, and complex benefit-corporation structures may be appropriate for some companies, but analysts should understand what rights they do and do not have.
Conclusion
The potential 2026 IPO wave deserves attention. It stands to provide public market participants access to many highly visible private companies in exciting, fast-growing industries, reshaping index composition faster than prior IPO cycles. It could also introduce a large amount of new equity supply into a market already defined by high concentration, heavy passive ownership, and elevated expectations for AI-related growth.
Our message is balanced. New public equity opportunities can be the starting point for extraordinary long-term investments, but the first public price is not automatically attractive just because the company is innovative. Historically, first-year IPO performance has been choppy, the median outcome has been negative in our sample, and drawdowns have been severe. The coming class may end up including one or multiple truly exceptional businesses. That still does not mean every new issue will be a good investment on day one.
For market participants, the framework should be disciplined: understand the business, assess the valuation, evaluate the path to profitability, consider the float and lockup structure, and be honest about position sizing. Public markets are very good at converting stories into prices. The hard part is determining whether the price leaves enough room for the story to unfold.
Asset Allocation Insights
The LPL Research Strategic and Tactical Asset Allocation Committee (STAAC) maintains its recommendation for a tactical equity overweight and fixed income underweight. While maintaining our equity and U.S. equity overweights, the Committee favors neutral style exposure as a result of stretched market positioning and technical indicators following the recent growth-led rally. As such, this view is expressed via a defensive factor tilt given our expectation for bouts of volatility until the macro backdrop begins to improve as the situation in the Strait of Hormuz eventually plays out to a resolution, allowing markets to refocus on a broadly healthy fundamental landscape.
Within equity sectors, we hold an overweight stance toward the energy sector due to logistical challenges surrounding normalizing global oil flows. The STAAC believes oil prices may stay higher for longer than markets currently anticipate and places value on this hedge against potential additional Mideast flare ups. We also remain overweight industrials, supported by strong earnings momentum, favorable technicals, and continued tailwinds from fiscal spending and AI investment.
LPL Financial does not offer access to or purchase of initial public offerings (IPOs).
This material is intended for informational and educational purposes only and does not constitute investment research, a research report, or a recommendation regarding any specific security or issuer.
Thomas Shipp, CFA, Head of Equity Research, LPL Financial
Tucker Beale, Sr. Equity Research Analyst, LPL Financial
Important Disclosures
This material is for general information only and is not intended to provide specific advice or recommendations for any individual. There is no assurance that the views or strategies discussed are suitable for all investors or will yield positive outcomes. Investing involves risks including possible loss of principal. Any economic forecasts set forth may not develop as predicted and are subject to change.
References to markets, asset classes, and sectors are generally regarding the corresponding market index. Indexes are unmanaged statistical composites and cannot be invested into directly. Index performance is not indicative of the performance of any investment and do not reflect fees, expenses, or sales charges. All performance referenced is historical and is no guarantee of future results.
Any company names noted herein are for educational purposes only and not an indication of trading intent or a solicitation of their products or services. LPL Financial doesn't provide research on individual equities.
All information is believed to be from reliable sources; however, LPL Financial makes no representation as to its completeness or accuracy.
All investing involves risk, including possible loss of principal.
US Treasuries may be considered "safe haven" investments but do carry some degree of risk including interest rate, credit, and market risk. Bonds are subject to market and interest rate risk if sold prior to maturity. Bond values will decline as interest rates rise and bonds are subject to availability and change in price.
The Standard & Poor's 500 Index (S&P500) is a capitalization-weighted index of 500 stocks designed to measure performance of the broad domestic economy through changes in the aggregate market value of 500 stocks representing all major industries.
The PE ratio (price-to-earnings ratio) is a measure of the price paid for a share relative to the annual net income or profit earned by the firm per share. It is a financial ratio used for valuation: a higher PE ratio means that investors are paying more for each unit of net income, so the stock is more expensive compared to one with lower PE ratio.
Earnings per share (EPS) is the portion of a company's profit allocated to each outstanding share of common stock. EPS serves as an indicator of a company's profitability. Earnings per share is generally considered to be the single most important variable in determining a share's price. It is also a major component used to calculate the price-to-earnings valuation ratio.
All index data from FactSet or Bloomberg.
This research material has been prepared by LPL Financial LLC.
Not Insured by FDIC/NCUA or Any Other Government Agency | Not Bank/Credit Union Guaranteed | Not Bank/Credit Union Deposits or Obligations | May Lose Value
RES-0007122-0526 Tracking #1120632 | #1120634 (Exp. 06/27)